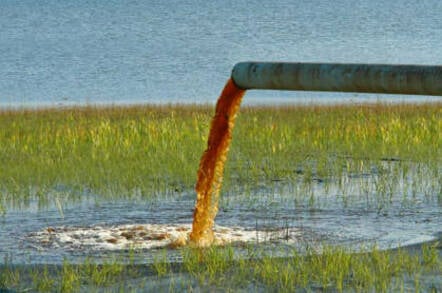
Data on a US EPA website that has escaped The Donald Trump-Administrator Pruitt scrubbing and science-obliterating machine lets you track decades of Wisconsin waterway pollution history.

I will post below more data to supplement information I wrote about in January that documented the skyrocketing number of Wisconsin waterways that have been added by the Wisconsin DNR to official US EPA lists during the Walker years.
As I have said, and documented, it's not a coincidence - - and last month's assaults on Wisconsin wetlands and waters by Walker and the equally business-obeisant GOP-controlled Legislature portend more pollution.
So now click on this US EPA webpage to track many trends in Wisconsin waterway pollution - - with these caveats:
Numbers are only available for some years while later years have more detailed reporting, and some charts describe only those waters or acreages actually assessed, so clearly do not represent 100% of possible impairments.
I was struck by the persistent presence of mercury and the growth of phosphorous contamination in the few categories I pulled out - - the latter not surprising because under Walker the state relaxed the time frame in which phosphorous discharges were to be addressed.
Note also there is additional data in the 2016 charge specific to lakes, and shorelines, and also data for fecal coliform bacteria, livestock grazing or animal feeding operations listed as impairment causes or probable sources.
From the EPA site:
-------------------------------------------------------------------------------------
Causes of Impairment
Description of this table
Description of this table

I will post below more data to supplement information I wrote about in January that documented the skyrocketing number of Wisconsin waterways that have been added by the Wisconsin DNR to official US EPA lists during the Walker years.
As I have said, and documented, it's not a coincidence - - and last month's assaults on Wisconsin wetlands and waters by Walker and the equally business-obeisant GOP-controlled Legislature portend more pollution.
So now click on this US EPA webpage to track many trends in Wisconsin waterway pollution - - with these caveats:
Numbers are only available for some years while later years have more detailed reporting, and some charts describe only those waters or acreages actually assessed, so clearly do not represent 100% of possible impairments.
I was struck by the persistent presence of mercury and the growth of phosphorous contamination in the few categories I pulled out - - the latter not surprising because under Walker the state relaxed the time frame in which phosphorous discharges were to be addressed.
Note also there is additional data in the 2016 charge specific to lakes, and shorelines, and also data for fecal coliform bacteria, livestock grazing or animal feeding operations listed as impairment causes or probable sources.
From the EPA site:
-------------------------------------------------------------------------------------
Wisconsin Cumulative TMDLs by Pollutant
This chart includes TMDLs since October 1, 1995.
Description of this table| NOTE: Click on the underlined "Pollutant" value to see associated listed waters for which a TMDL was developed. Click on the underlined "Number of TMDLs" value to see a listing of those TMDLs for the pollutant. | ||
| Pollutant | Number of TMDLs | Number of Causes of Impairment Addressed |
|---|---|---|
| Total Suspended Solids (TSS) |  96 96 |
161 |
| Phosphorus, Total |  70 70 |
108 |
| Sediment |  56 56 |
133 |
| Phosphorus |  14 14 |
22 |
Wisconsin 2008 Causes of Impairment for 303(d) Listed Waters
Description of this table| NOTE: Click on a cause of impairment (e.g. pathogens) to see the specific state-reported causes that are grouped to make up this category. Click on the "Number of Causes of Impairment Reported" to see a list of waters with that cause of impairment. | |
| Cause of Impairment Group Name | Number of Causes of Impairment Reported |
|---|---|
| Mercury |  282 282 |
| Sediment |  191 191 |
| Nutrients |  185 185 |
Site-specific Targeted Monitoring Results
Causes of Impairment
Wisconsin Rivers and Streams 2016
Description of this table
| Cause of Impairment | Cause of Impairment Group | Miles Threatened or Impaired |
|---|---|---|
| Phosphorus, Total | Nutrients |  5,474.2 5,474.2 |
| Total Suspended Solids (TSS) | Turbidity |  1,526.6 1,526.6 |
| Polychlorinated Biphenyls (PCBs) | Polychlorinated Biphenyls (PCBs) |  1,448.6 1,448.6 |
| Mercury | Mercury |  888.2 888.2 |
Wisconsin Causes of Impairment for Reporting Year 2016
Description of this table